Campfire
Archive Tags About

A Grafana Dashboard for PegaProx Prometheus Exporter

Visit link →
Screenshot of A Grafana Dashboard for PegaProx Prometheus Exporter
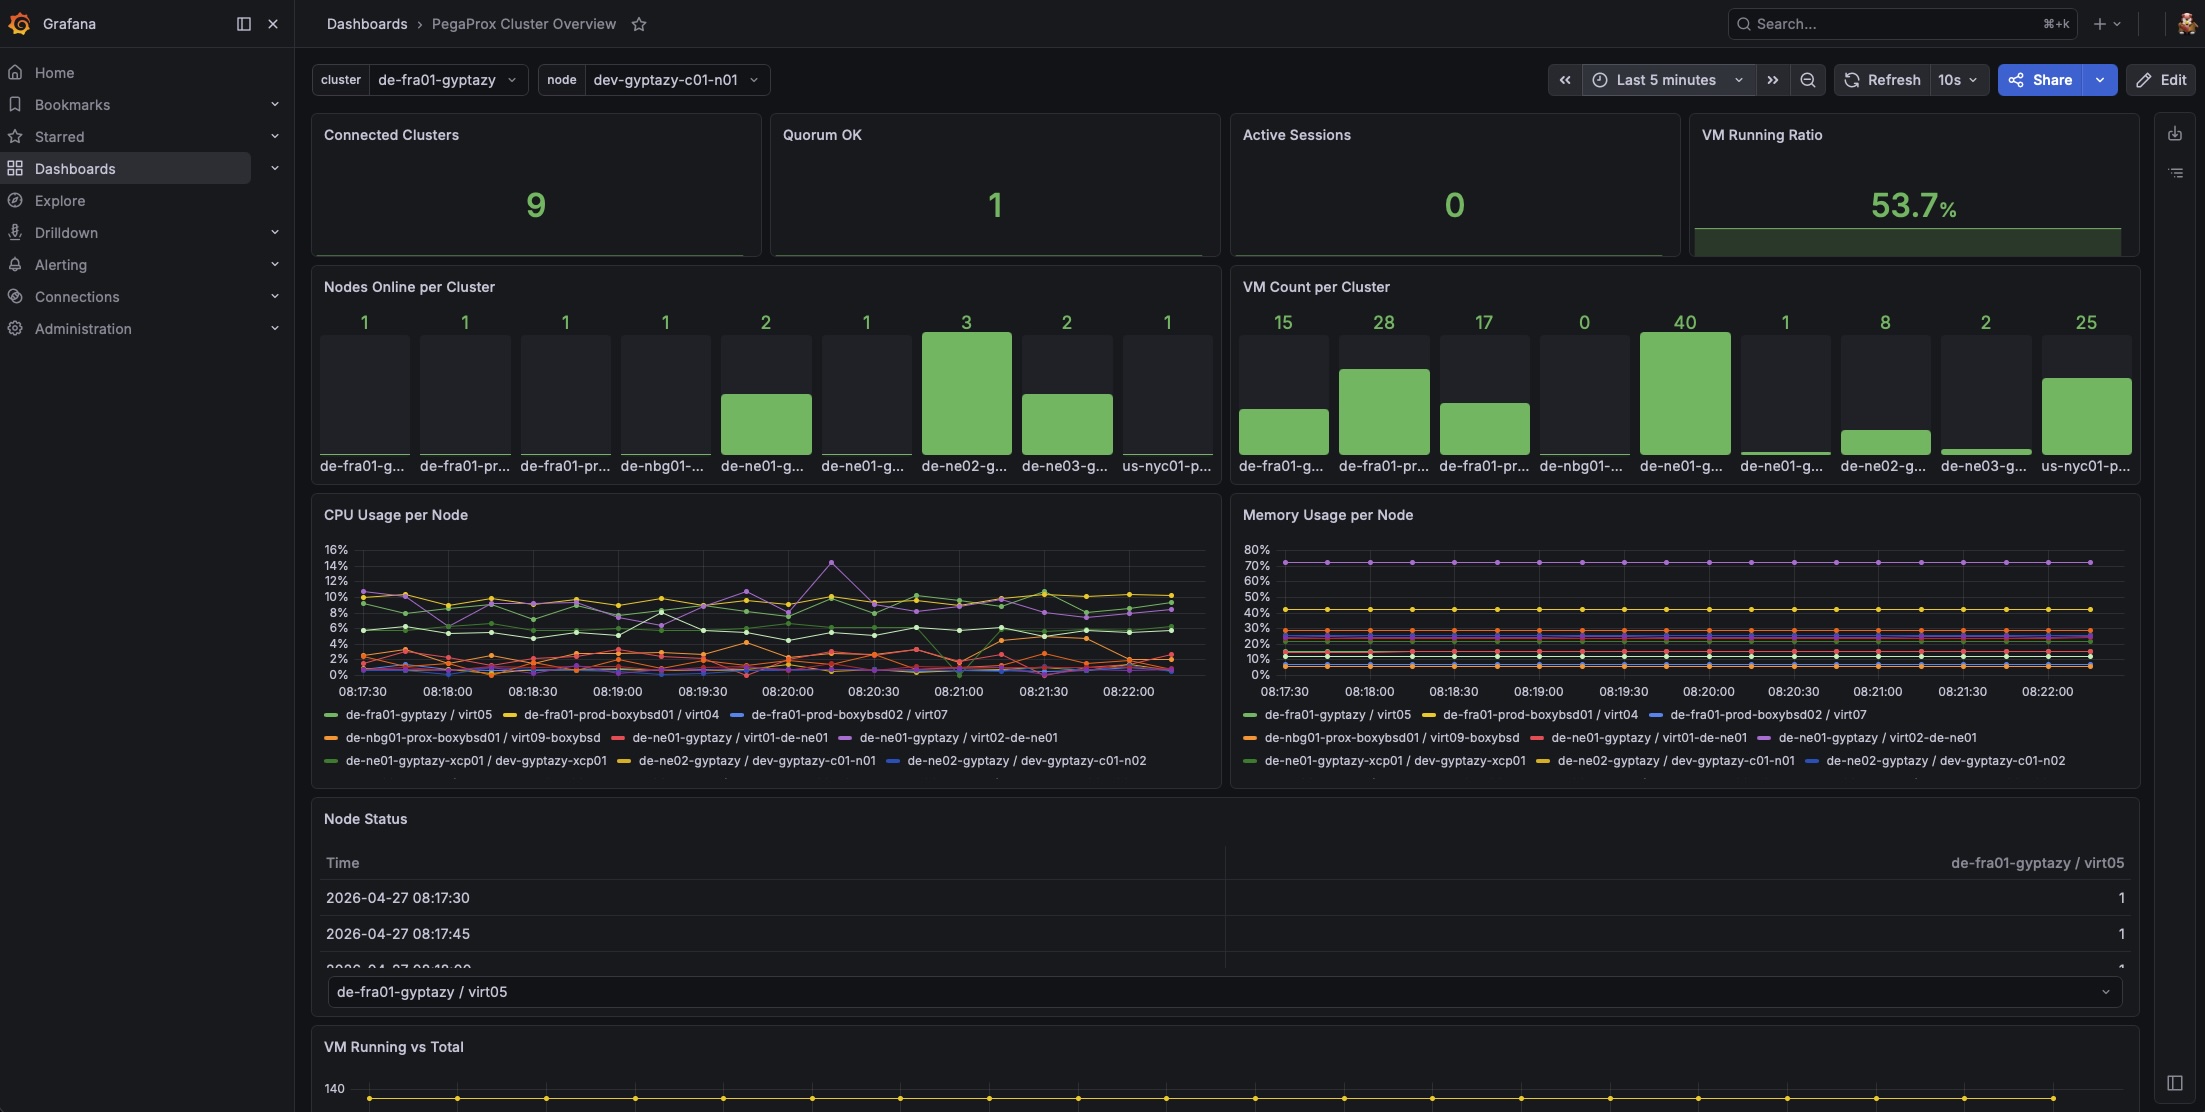
Monitor your Proxmox clusters with the PegaProx Prometheus Grafana Dashboard. Visualize metrics, track node health, and gain real-time insights with a lightweight and powerful monitoring solution.
April 29, 2026
monitoring grafana
Permalink: 2026/w18/a-grafana-dashboard-for-pegaprox-prometheus-exporter

Related Links

  • Grafana 13 release: get value from your data faster, manage operations at scale, and more! | Grafana Labs grafana monitoring
  • The Grafana trust problem monitoring grafana
  • Home | Dozzle monitoring
  • Stop Overengineering Logs. Use This Instead monitoring
  • Custom VCF Operations Dashboard for CPU Support in VCF Releases monitoring
← Back to Week 18

© 2026 Timo Sugliani · Weekly curated links, shared around the tech campfire